Prometheus is a systems and service monitoring system [Link].
Out of the box, Prometheus monitored the host where it is running and uses collectors such as Node Explorer [Link] to scrape metrics from other endpoints.
INSTALLING PROMETHEUS
Some will say that you should not use the distribution source because it is not frequently updated but this is the most reliable source and will upgrade / patch with the system:
sudo apt-get install prometheus prometheus-node-exporter prometheus-pushgateway prometheus-alertmanager -y
sudo systemctl stop prometheus
Enable the API (it will provide additional features):
sudo nano /etc/systemd/system/multi-user.target.wants/prometheus.service
Edit the following line:
ExecStart=/usr/bin/prometheus --web.enable-lifecycle $ARGS
Note: the default retention period of the collected data is 15 days. To customize this period add the argument –storage.tsdb.retention.time=30d with the desired period.
Apply the change and start the service:
sudo systemctl daemon-reload
sudo systemctl start prometheus
sudo systemctl status prometheus
It could also be deployed as a Docker Container (just for reference):
sudo docker run --name prometheus -d -p 127.0.0.1:9090:9090 prom/prometheus
INSTALLING NODE_EXPLORER ON EACH OF THE MONITORED HOSTS
sudo apt install prometheus-node-exporter -y
sudo systemctl start prometheus-node-exporter
sudo systemctl enable prometheus-node-exporter
sudo systemctl status prometheus-node-exporter
sudo ufw allow from 192.168.1.162 to any port 9100
Note: replace the IP 192.168.1.162 with the IP of the server where Prometheus is running.
CONFIGURING THE PROMETHEUS TO REACH THE MONITORED HOSTS
sudo nano /etc/prometheus/prometheus.yml
Example of configuration:
global:
  scrape_interval: 1s
  evaluation_interval: 1s
alerting:
  alertmanagers:
  - static_configs:
    - targets: ['192.168.1.162:9093']
scrape_configs:
  - job_name: 'prometheus'
    scrape_interval: 1s
    scrape_timeout: 1s
    static_configs:
      - targets: ['192.168.1.162:9090']
  - job_name: 'nodes'
    scrape_interval: 1s
    scrape_timeout: 1s
    static_configs:
      - targets: ['192.168.1.162:9100', '192.168.1.163:9100', '192.168.1.164:9100']
Note: I recommend you use names instead of IPs. You can configure the translation in the file /etc/hosts.
Reload the configuration using the API:
curl -X POST http://localhost:9090/-/reload
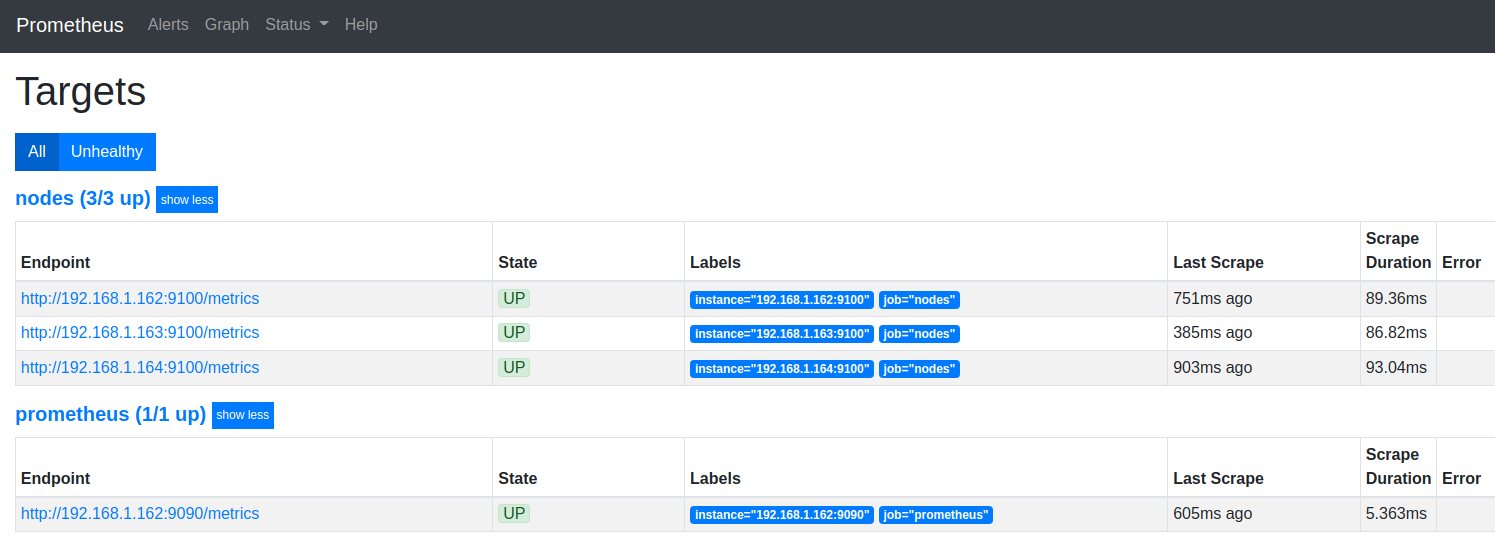
Access Prometheus WebUI with a browser http://192.168.1.162:9090/ and navigate to Status > Targets.
INSTALLING GRAFANA
Grafana is a powerful tool to visualize data over time. It is the most popular dashboard viewer for Prometheus but not limited to it [Link].
sudo apt-get install -y apt-transport-https
sudo apt-get install -y software-properties-common wget
sudo wget -q -O /usr/share/keyrings/grafana.key https://apt.grafana.com/gpg.key
echo "deb [signed-by=/usr/share/keyrings/grafana.key] https://apt.grafana.com stable main" | sudo tee -a /etc/apt/sources.list.d/grafana.list
sudo apt-get update
sudo apt-get install grafana -y
sudo systemctl start grafana-server
sudo systemctl enable grafana-server
sudo systemctl status grafana-server
sudo ufw allow 3000
Access the Web UI on http://192.168.1.162:3000/ and change the default password (admin:admin) immediately.
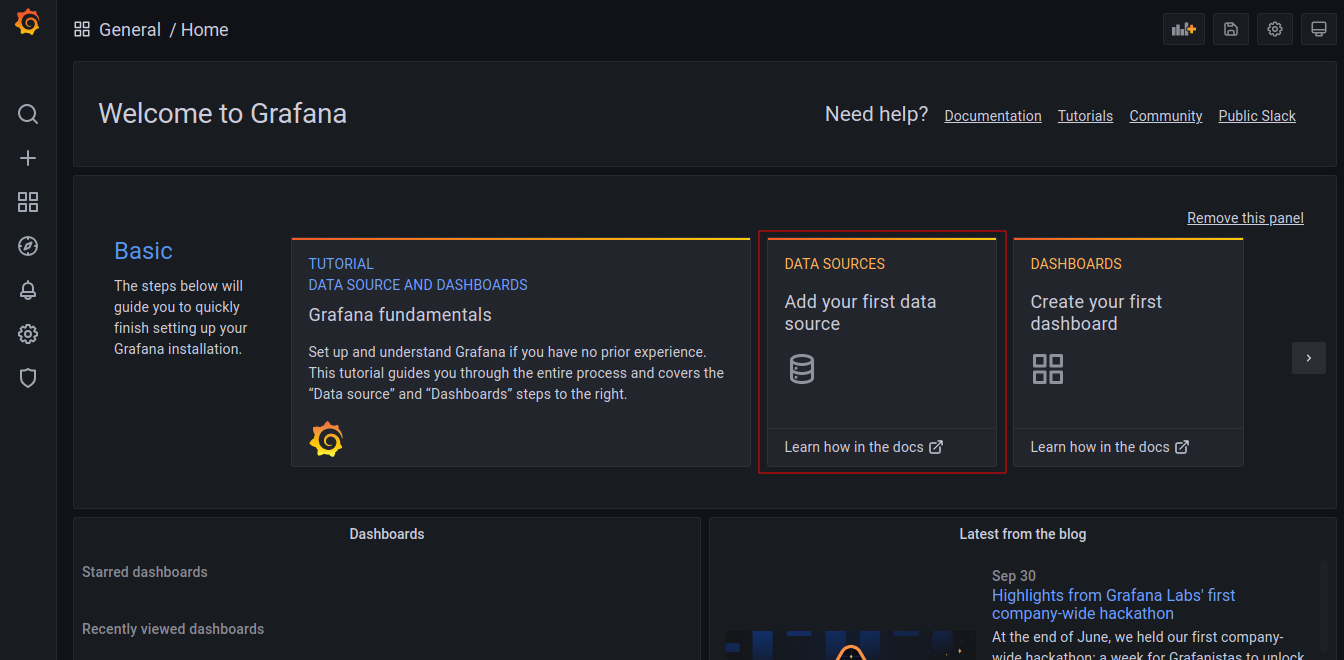
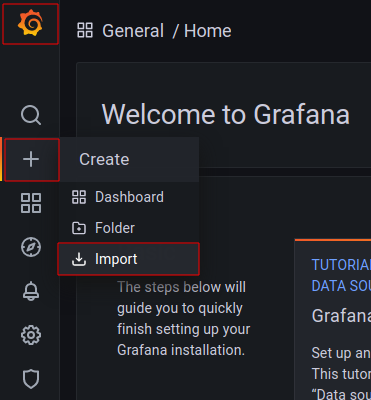
Back to Home, import a Dashboard View from the online repository [Link].
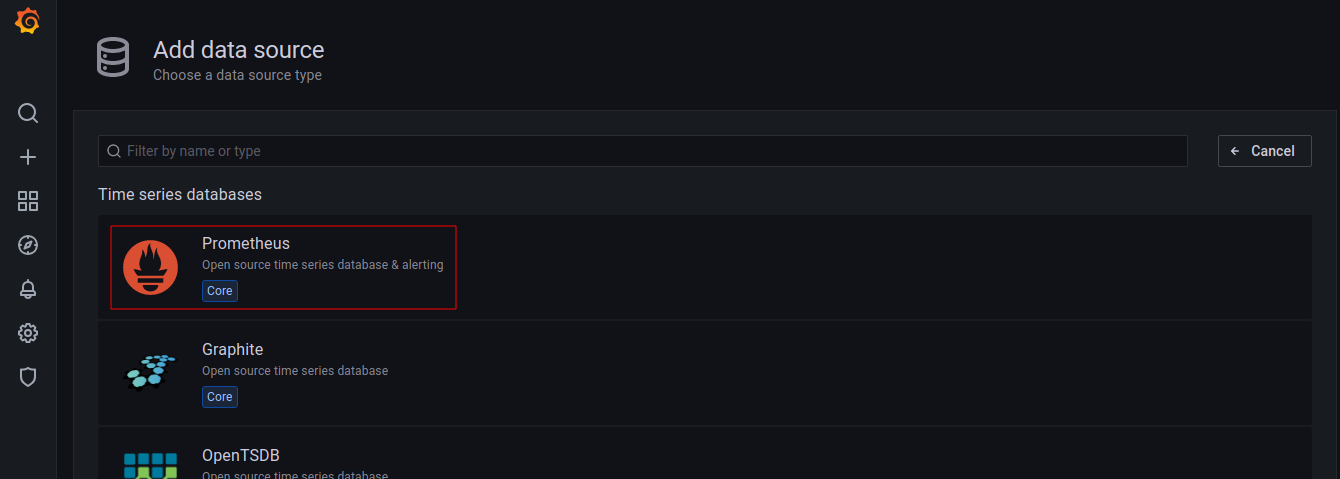
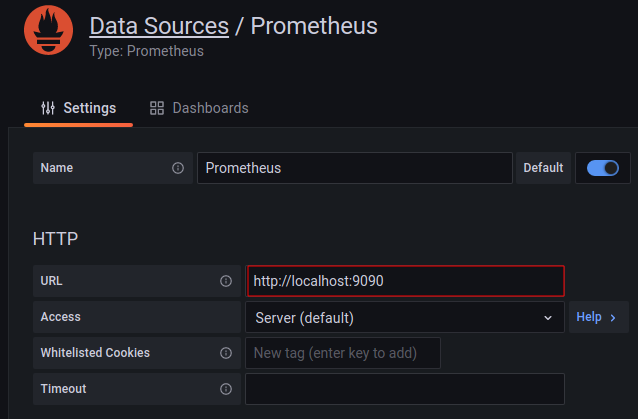
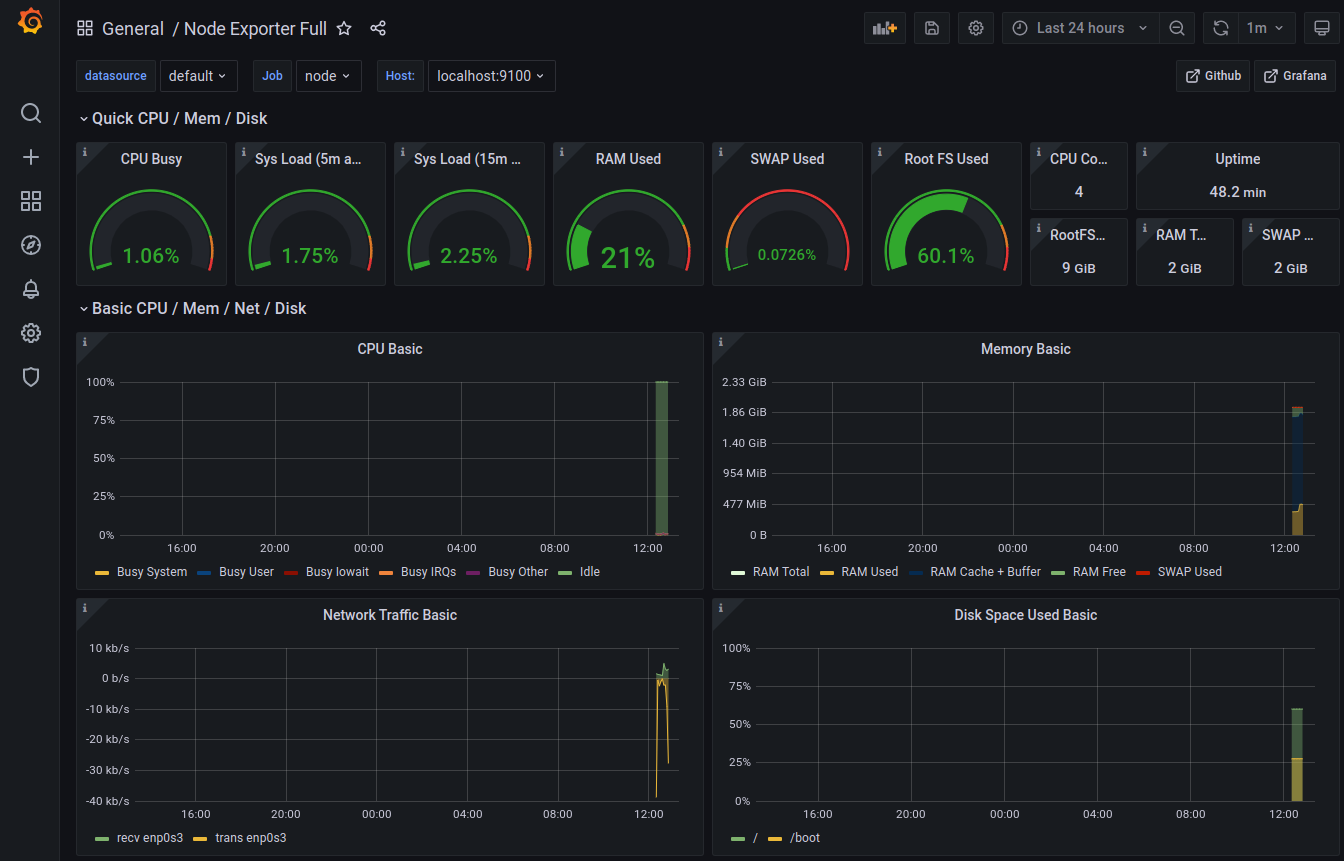
Import the dashboard 1860 and select the data source as Prometheus.
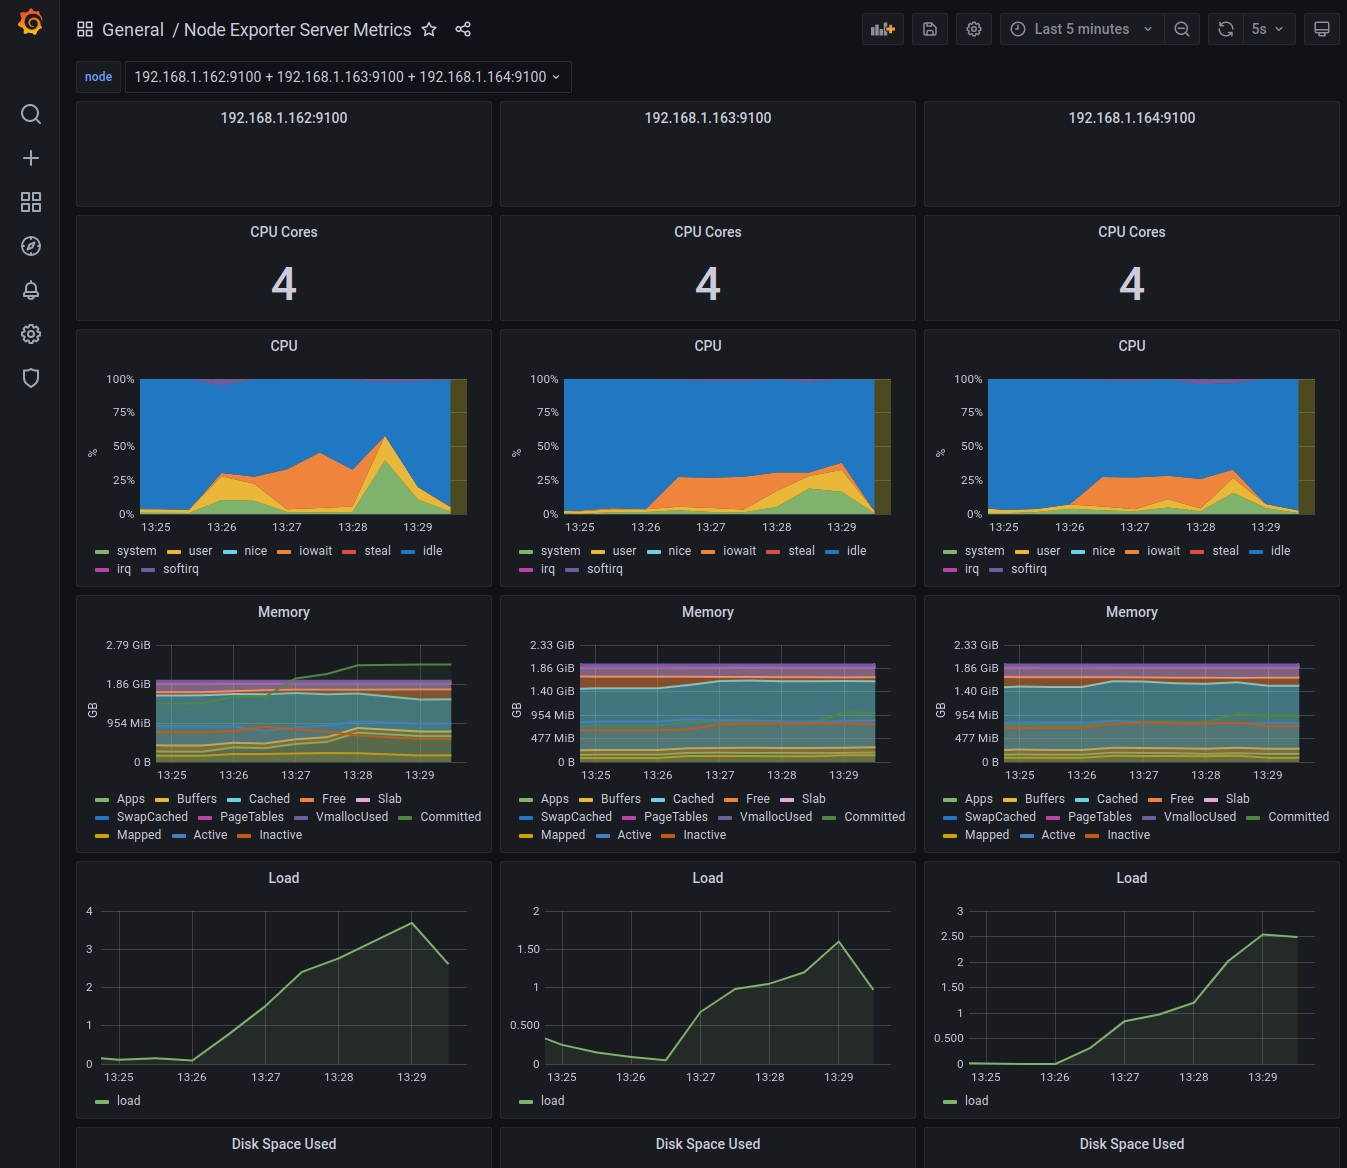
Repeat the import procedure with the number 405.
Go to the dashboard, navigate and customize your imported view:
REFLECTION
Keep monitoring the storage usage on /var/lib/prometheus/metrics2/ until you define the retention time and scraping frequency that best suits your need.
For reference, I have set up the server where the Prometheus runs on, and two other servers. It scrapes data from 4 sources every 1 second and every 24h it accumulates about 800MB of data.
The email alerts would look much nicer with the image renderer:
sudo grafana-cli plugins install grafana-image-renderer
The SMTP configuration can be found at:
sudo nano /etc/grafana/grafana.ini
It is always recommended to restart Grafana after making changes to its configurations or installing plugins:
sudo systemctl restart grafana-server
To use AWS CloudWatch as a data source for Grafana follow the step below making the adjustments accordingly:
IAM > Policies > Add service: CloudWatch > Allow for: ListMetrics, GetMetricData, GetMetricStatistics.
IAM > Roles > AWS Service > EC2 > Select the Policy to the Role.
IAM > Users > Add User > Attach Existent Policy > Select the Policy to the User > Get AccessKey and SecretKey.
EC2 > Select the Instance > Actions > Instance Settings > Attach/Replace IAM Role.
Then use the created AccessKey and SecretKey to add the data source using the Grafana web application.